
Fundamental Overview
Much like the stock market, Bitcoin found support this week from the dovish comments from Fed members. Fed’s Williams was the first opening the door for a cut in September which marked the bottom in many risk assets.
That was followed by Fed’s Daly and Fed’s Kashkari who cited the NFP report and revisions as a reason to start thinking about cuts. Yesterday, Bitcoin and other cryptocurrencies rallied on the news that Trump was going to sign an executive order allowing cryptocurrencies and other alternative assets in retirement plans.
Looking ahead, the focus has now turned to the US CPI report coming up next week. Lower than expected data should seal the expectations for a rate cut in September and Fed Chair Powell will likely signal that at the Jackson Hole Symposium. On the other hand, higher than expected figures might trigger a hawkish repricing and weigh on risk assets keeping us in rangebound mode.
Bitcoin Technical Analysis – Daily Timeframe
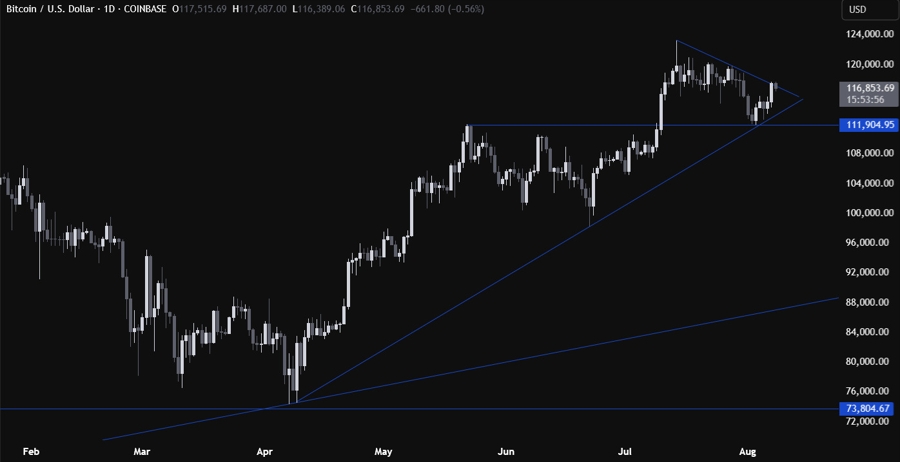
On the daily chart, we can see that Bitcoin eventually bounced from the major trendline around the 112,000 level and extended the gains into the downward trendline. This is where we can expect the sellers to step in with a defined risk above the trendline to position for a drop back into the major upward trendline. The buyers, on the other hand, will look for a break higher to increase the bullish bets into a new all-time high.
Bitcoin Technical Analysis – 4 hour Timeframe
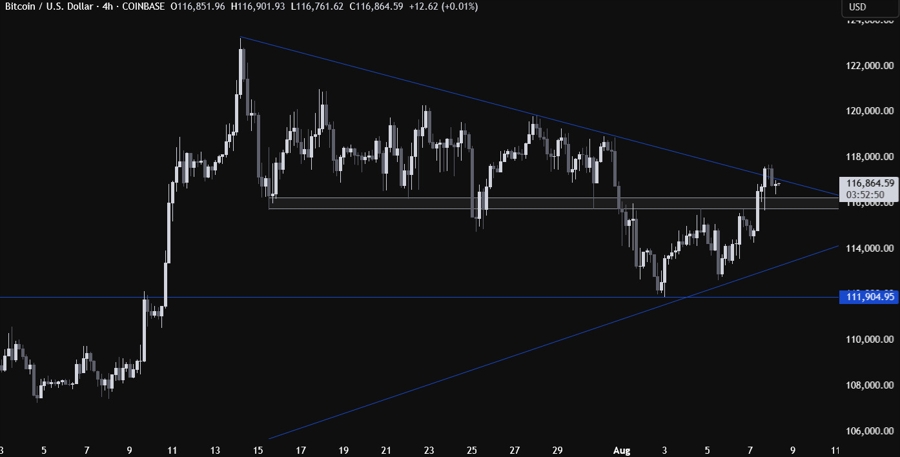
On the 4 hour chart, we can see that we have a strong zone around the 116,000 level where the price got rejected from several times in the past weeks. If we get a pullback from the trendline, we can expect the buyers to step in there with a defined risk below the zone to position for a break above the downward trendline. The sellers, on the other hand, will look for a break lower to increase the bearish bets into the major upward trendline.
Bitcoin Technical Analysis – 1 hour Timeframe
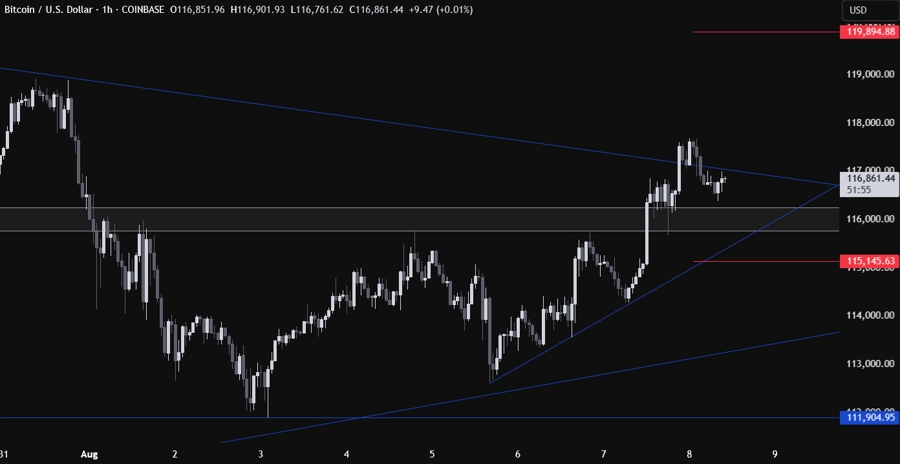
On the 1 hour chart, we can see that we have another minor upward trendline defining the bullish momentum on this timeframe. The buyers will likely continue to lean on it to keep pushing into new highs, while the sellers will look for a break lower to target a pullback into the major trendline. The red lines define the average daily range for today.
