
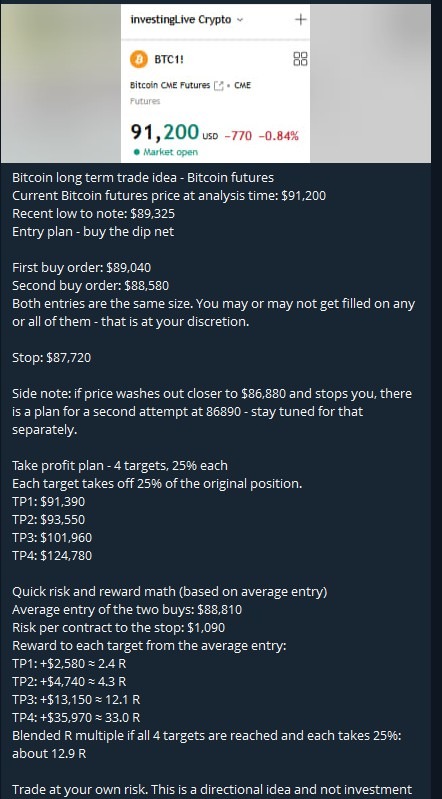
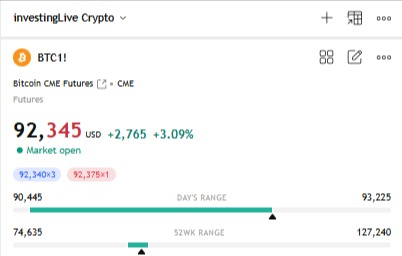
Important update: Even when you buy the dip, you need to play defense. That's what we did when reaching our 1st profit target at $91,390 after filling the buy at $89,040 (all prices are in BTC futures). Even on our ETH long, as updated on our Telegram channel (still not there? Hop on over, see the link below, we'll be glad to have you), we moved the stop to the entry. Both these key adjustments (which we do in every trade as well as in our tradeCompass methodology), are critical. Price reversed after a temporary pop as Nvidia boosted the market rally.. temporarily! Our stops at the entry saved us from giving back to Mister Market. All updates are given on our Telegram channel.
Traders are also looking to see if this blue channel holds. Stay tuned for the our next item tommorrow on Bitcoin. Follow our Crypto Section.
Bitcoin Long-Term Technical Analysis: Is the Current Dip a Buying Opportunity?
Date: November 20, 2025
Bitcoin has recently experienced significant volatility, leaving many investors wondering if the current price action represents a market correction or a strategic entry point. In his latest analysis of Bitcoin futures, Itai Levitan from investingLive.com (formerly ForexLive.com) breaks down the 12-hour and 4-hour charts to identify key support levels and potential breakout targets.
Join the Free Telegram Channel: For more real-time trade ideas and market analysis, join the official investingLive.com Stocks Telegram channel for free: https://t.me/investingLiveStocks
Trade Update: Bitcoin Long Strategy – Profit Secured & Risk-Free!
Yesteday we shared a high-potential Bitcoin long setup exclusively with our investingLive.com Telegram community, and it played out perfectly. Following our strict risk management rules, we have already moved our stop loss to the entry price and secured partial profits, making this a completely risk-free trade! This discipline is a core pillar of our trading philosophy—prioritizing capital protection while letting winners run. If you want to learn how to execute stress-free trades like this and see our real-time adjustments, join our free Telegram channel today.
Back to the Bitcoin Technical Analysis Video Above: Analyzing the Previous "Messy" Break Down of Bitcoin
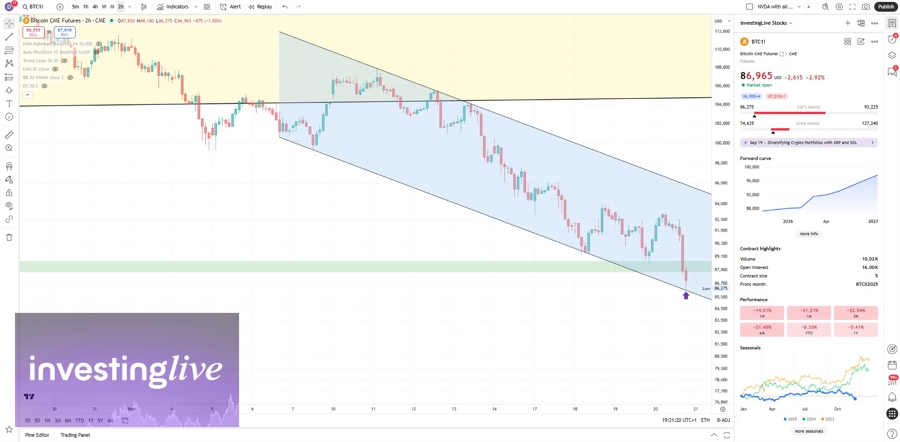
Looking at the 12-hour charts, the market recently witnessed what Levitan describes as a "messy breakout down." This movement activated a bear channel, signaling short-term downward pressure. However, for long-term investors, technical context is crucial.
Despite this bearish activation, the price action has entered a specific "green zone." According to the "Buy the Dip" plan shared on the investingLive.com Telegram channel, this area represents a calculated opportunity for accumulation rather than a signal to panic sell.
The 4-Hour Chart: Key Levels to Watch for the Breakout Up in Bitcoin (and the bottom may have already printed yesterday...)
When zooming into the 4-hour time frame, the analysis shifts to identifying the reversal setup. Different algorithms may draw the channel lines slightly differently—catching various highs or closing prices—but the longer-term view remains consistent.
Levitan notes that the market may be forming a "handle" structure. This consolidation is often a precursor to a breakout. Traders should keep a close watch on the $95,000 to $95,500 price range. A decisive move above this level could confirm a "breakout up," potentially followed by a retest of that level as support before continuing higher.
Long-Term Price Prediction: The Road to $130k
If the bullish scenario plays out and Bitcoin successfully breaks out from the current structure, the immediate upside targets are significant:
First Target: A retest of the $104,000 area.
Extended Target: If momentum sustains and the price penetrates the $104k resistance, the analysis suggests a potential rally all the way to $130,000.
Bitcoin Price Prediction
Well, if you'd be on our Telegram Channel, maybe you would have bought the dip on Bitcoin. Since we do not know, or anyone else knows, if this is for sure that longer term dip, we mitigate our risk by moving the stop of the remiainder of the Long, once the first of 4 profit targets are reached (done already), and we have a last target at a new ATH.
So, let's recap: Bitcoin's Current Trend: Bear channel active on 12-hour charts, but currently in a buy zone.
Key Short Term Resistance (for the next guidance): Watch for a breakout around $95,000 - $95,500.
Future Targets: Potential moves toward $104,000 and later to possibly moon it all the way to $130,000.
Disclaimer: This content is for informational purposes only and does not constitute financial advice. Trading cryptocurrencies involves significant risk. Always trade at your own risk and conduct your own research.
